How to Debug Web Page in Opera Browser
Latest version of Opera browser comes with inbuilt developer tools called Dragonfly similar to Internet Explorer. Dragonfly is fully featured tool equipped with all necessary tool require to debug a web page. Web page debugging was nightmare in the earlier version of Opera. It is an alternative of FireBug for Firefox and Chrome. More is that it is built-in tool so you don’t need to install it separately.
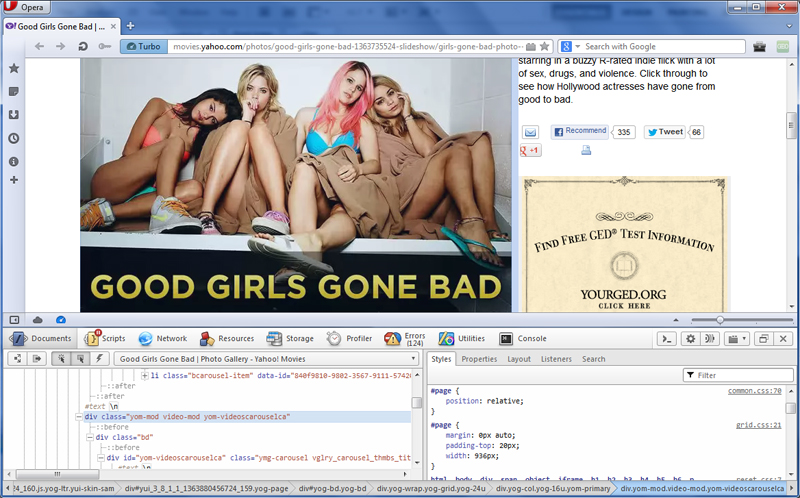 It load DOM and you can change element values if needed. Other features are network traffic monitor, searching and ability, java script debugging, error logging, profiler, console, utility and remote debugging. Remote debugging feature allow developers to connect with dragonfly from remote devices. Utility tools allow you to take screenshot of web page.
Dragonfly Shortcut
- Menu Option: Opera -> Page -> Developer Tools -> Opera Dragonfly
- Windows: Ctrl + Shift + I
- Linux: Ctrl + Shift + I
- Mac: ? + ? + I
Recent Comments